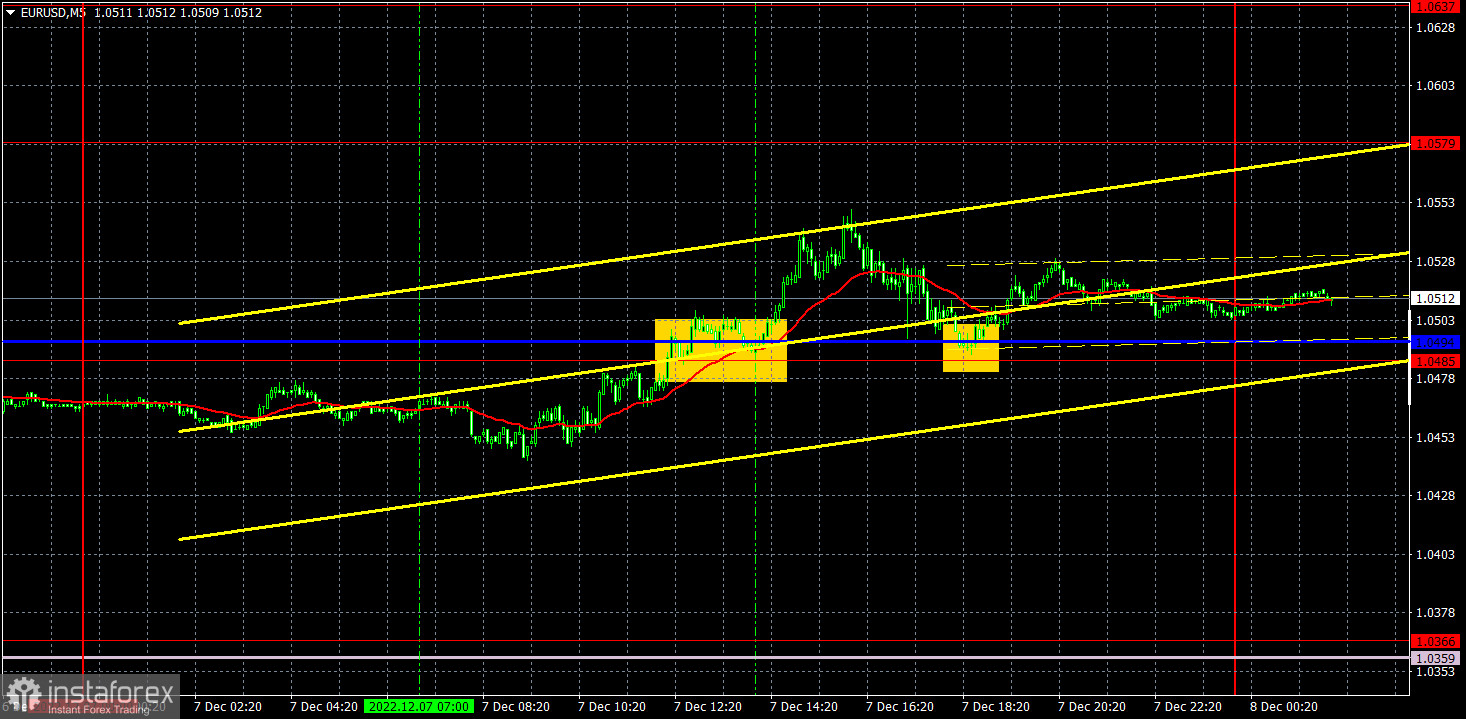
M5 chart of EUR/USD
The EUR/USD pair closed higher on Thursday. Traders left the Kijun-sen unnoticed although it was a rather strong base line. Volatility was low after ECB President Lagarde's speech. What is more, the macroeconomic calendar was empty on Thursday. In addition, the pair fluctuated and even ignored the important Ichimoku indicator. All in all, the quote's recent movement can hardly be logically explained. The pair has been unable to show a proper bearish correction lately.
Speaking of trading signals, the situation was not the best one either. The pair's daily volatility totaled about 70 pips, which is not enough even for the euro. In this light, we could hardly expect strong trading signals to be made. In addition, the intraday range of 1.0485-1.0509 limited significantly the number of signals. As a result, the pair twice bounced off the area and twice produced a buy signal. When the first signal was generated, the price advanced by just 10 pips. Therefore, long positions should have been left open, as no sell signal for manual closing of trades followed. After the second signal, the quote rose by 40 pips. Positions should have been closed manually, which could have brought traders a profit of some 20-30 pips.
COT report:
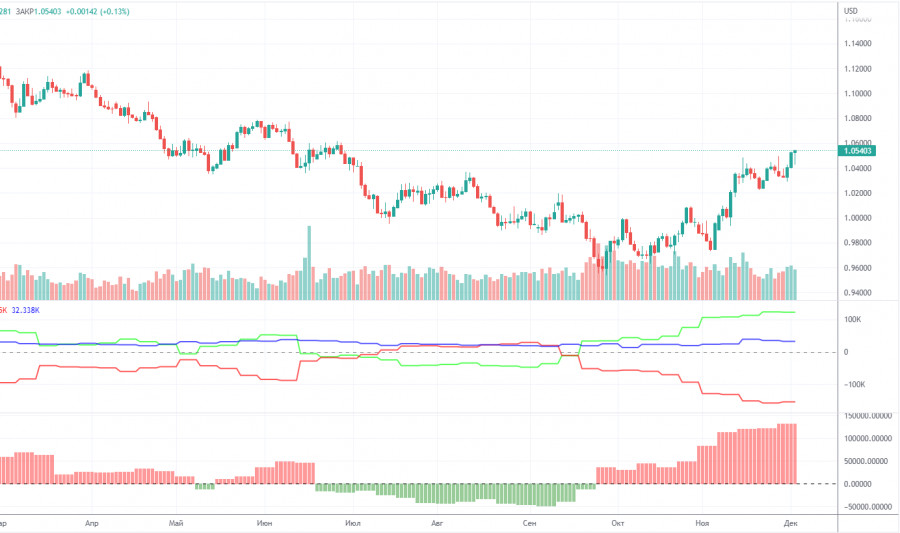
As for COT reports in 2022, they reflected bullish sentiment in the first six months of the year, while EUR/USD was bearish. Then, they illustrated bearish sentiment for several months with the euro being also bearish. Currently, the net position of non-commercial traders is again bullish and increasing. Although the euro is rising, a rather high value of the net position allows us to assume an early completion of the uptrend. During the reporting week, the number of long positions held by non-commercial traders increased by 4,700 and that of short positions grew by 4,600. The euro's recent rise is gradually coming in line with the figures illustrated in the COT report. Still, the greenback may resume growth under the influence of geopolitical factors or the lack of factors for further strengthening in the euro. The green and red lines of the first indicator moved far away from each other, which may indicate the end of the uptrend. The number of long positions exceeds that of short positions by 133,000. Therefore, the net position of non-commercial traders may continue to rise further but without triggering a similar rise in the euro. When it comes to the total number of longs and shorts across all categories of traders, there are now 33,000 more short positions (755,000 vs 723,000).
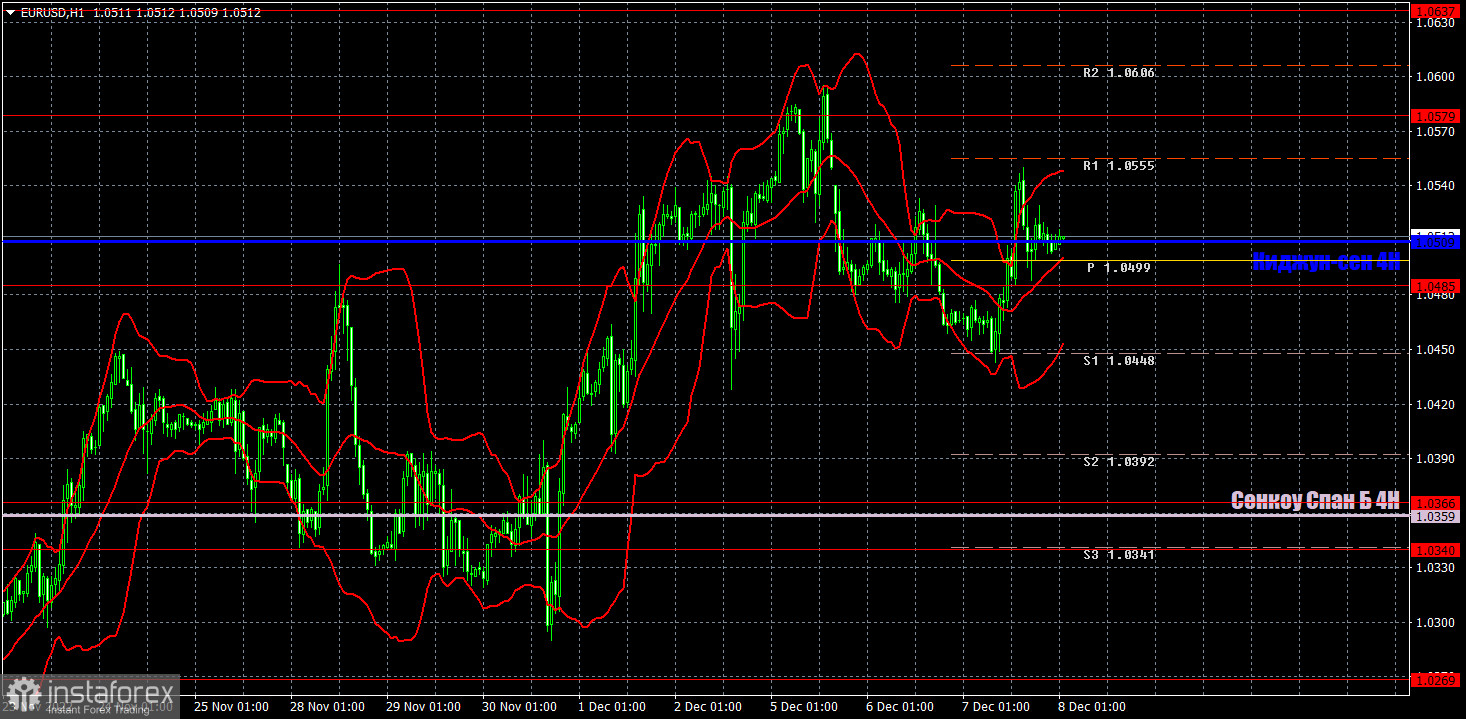
H1 chart of EUR/USD
In the H1 time frame, EUR/USD may resume the uptrend. The pair failed to settle below the Senkou Span B. Therefore, the bullish movement may go on. Technical factors indicated that it is a highly likely scenario now. However, fundamental and macroeconomic factors illustrate the opposite. Anyway, there have been no reasons for a downtrend so far. On Friday, trading levels are seen at 1.0195, 1.0269, 1.0340-1.0366, 1.0485, 1.0579, 1.0637, as well as 1.0442 (Senkou Span B) and 1.0514 (Kijun-sen). Ichimoku indicator lines may move during the day, which should be taken into account when determining trading signals. There are also support and resistance although no signals are made near these levels. Signals can be generated whenever the price bounces or breaks through extreme levels and lines. Don't forget to place a stop-loss order at the breakeven point when the price passes 15 pips in the right direction. It can help you minimize losses when a signal turns out to be false. On December 9th, the macroeconomic calendar in the eurozone will be empty. The US will see the release of the Michigan consumer sentiment index. If the actual reading does not align with the forecast, the market's reaction may follow.
Indicators on charts:
Resistance/support - thick red lines, near which the trend may stop. They do not make trading signals.
The Kijun-sen and Senkou Span B lines are the Ichimoku indicator lines moved to the hourly timeframe from the 4-hour timeframe. They are also strong lines.
Extreme levels are thin red lines, from which the price used to bounce earlier. They can produce trading signals.
Yellow lines are trend lines, trend channels, and any other technical patterns.
Indicator 1 on the COT chart is the size of the net position of each trader category.
Indicator 2 on the COT chart is the size of the net position for the Non-commercial group of traders.