empty
 
 
04.10.2022 07:50 AM
Breaking forecast for EUR/USD on October 4, 2022

Thus, final data on the eurozone and the US manufacturing PMI slightly differed from preliminary estimates. In Europe, the final data was below the forecast, whereas in the US, it was ahead of projections. Thus, in the eurozone, the indicator should have increased to 49.6 points from 48.5 points, but it dropped by 48.4 points.

In the US, the manufacturing PMI advanced to 52.0 points from 51.5 points instead of rising to 51.8 points. Nevertheless, the euro was gaining in value, though very slowly. The climb was mainly triggered by the pound's appreciation caused by Liz Truss' refusal to cut taxes for the wealthy and her readiness to accept adjustments to the earlier offered plan.

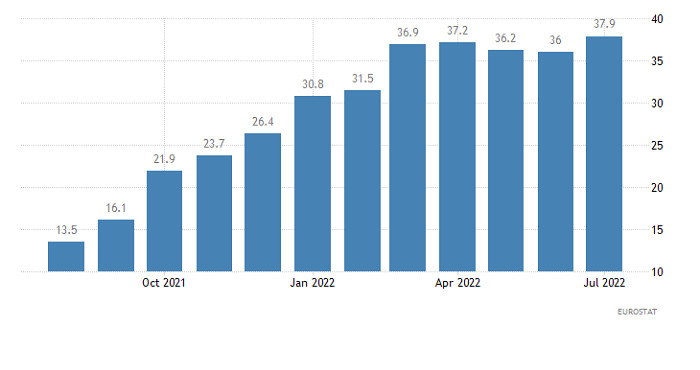
Today, the euro may grow thanks to the eurozone PPI figures, which may increase to 43.6% from 37.9%. The recent inflation data also unveiled a noticeable rise in consumer prices. It means that the PPI data will dispel all the doubts about a further rise in the key interest rate. The ECB has nothing to do but significantly tighten its monetary policy. In other words, interest rates will continue rising at least until next spring.

Meanwhile, the Federal Reserve will slacken its interest rates hike by the end of 2022. In the spring, it may even announce the first cut. As a result, in the foreseeable future, Europe's key interest rate will exceed the one in the US. Such a likelihood will boost the euro.

Eurozone PPI

This image is no longer relevant

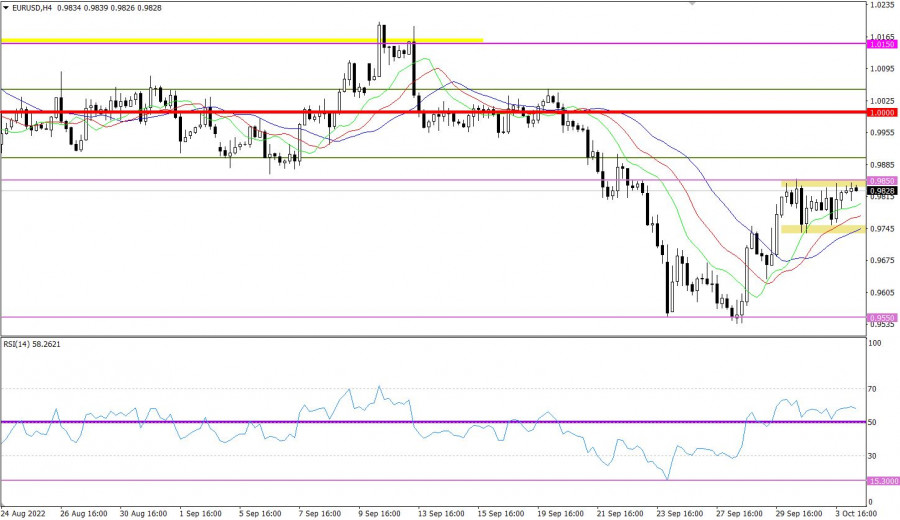
The euro/dollar pair reached the resistance level of 0.9850 amid the upward correction. After that, the volume of long positions dropped. As a result, the pair bounced and stagnated.

On the four-hour chart, the RSI technical indicator is hovering in the upper area of 50/70, which points to the fact that bullish sentiment prevails among traders. If the price upwardly intersects the 50 MA on the daily chart, the buy signal will become stronger.

On the four-hour chart, the Alligator's MAs are headed upwards, which also corresponds to the correctional movement. On the daily chart, the indicator is headed downwards, ignoring the correction.

This image is no longer relevant

Outlook

The price hovering within the range of 0.9750/0.9850 could be defined as a short-lived phenomenon, which may lead to the accumulation process. Under the current conditions, traders should wait for an outgoing impulse from either limit of the range.

In terms of the complex indicator analysis, we see that in the short-term and intraday periods, the indicator is providing a mixed signal because of the flat movement.

Dean Leo,
انسٹافاریکس کا تجزیاتی ماہر
© 2007-2024
انسٹافاریکس کے ساتھ کرپٹو کرنسی کی معاملاتی تبدیلیوں سے کمائیں۔
میٹا ٹریڈر 4 ڈاؤن لوڈ کریں اور اپنی پہلی ٹریڈ کھولیں۔
  • Grand Choice
    Contest by
    InstaForex
    InstaForex always strives to help you
    fulfill your biggest dreams.
    مقابلہ میں شامل ہوں
  • چانسی ڈیپازٹ
    اپنے اکاؤنٹ میں 3000 ڈالر جمع کروائیں اور حاصل کریں$9000 مزید!
    ہم مئي قرعہ اندازی کرتے ہیں $9000چانسی ڈیپازٹ نامی مقابلہ کے تحت
    اپنے اکاؤنٹ میں 3000 ڈالر جمع کروانے پر موقع حاصل کریں - اس شرط پر پورا اُترتے ہوئے اس مقابلہ میں شرکت کریں
    مقابلہ میں شامل ہوں
  • ٹریڈ وائز، ون ڈیوائس
    کم از کم 500 ڈالر کے ساتھ اپنے اکاؤنٹ کو ٹاپ اپ کریں، مقابلے کے لیے سائن اپ کریں، اور موبائل ڈیوائسز جیتنے کا موقع حاصل کریں۔
    مقابلہ میں شامل ہوں
  • 100 فیصد بونس
    اپنے ڈپازٹ پر 100 فیصد بونس حاصل کرنے کا آپ کا منفرد موقع
    بونس حاصل کریں
  • 55 فیصد بونس
    اپنے ہر ڈپازٹ پر 55 فیصد بونس کے لیے درخواست دیں
    بونس حاصل کریں
  • 30 فیصد بونس
    ہر بار جب آپ اپنا اکاؤنٹ ٹاپ اپ کریں تو 30 فیصد بونس حاصل کریں
    بونس حاصل کریں

تجویز کردہ مضامین

ابھی فوری بات نہیں کرسکتے ؟
اپنا سوال پوچھیں بذریعہ چیٹ.
Widget callback